Excavating Fuzzable Targets Through Static Analysis with Binary Ninja
Jun 07, 2021
#security #reversing #fuzzing #static-analysis #binary-ninjaI love looking at the awesome work the security community does in the area of fuzzing and dynamic analysis, and how new techniques are being incorporated to better improve upon their performance and viability against the ever increasing complexity of software. This can include new approaches in how we dynamically instrument and obtain coverage in closed-source binaries with frameworks like Intel Processor Trace, improving test case generation for structure-aware/grammar fuzzing against parsers and compilers, and even doing objective evaluation at the efficacy of scaling feedback-driven fuzzing and how it’s helped improve the overall state of software assurance.
However, as much as we’ve dedicated our time to radically improving how fuzzers work and perform, I do believe that we should also look into other areas part of the “fuzzing workflow” that don’t concern how fuzzers are being implemented, but rather how to assist them before and after any actual dynamic analysis, topics like distilling and filtering input corpora, or minimizing and triaging produced crashes.
So my goal today is to examine how we can better improve and routinize the process of fuzzing target discovery, where given some piece of executable or library dependency, we’re able to extrapolate a ranked list of function targets feasible for fuzzing, which we can then use to build up a harness. I believe that this can immensely improve the vulnerability discovery process, especially when approaching closed-source and exotic software, by routinizing the manual reverse engineering process one might undertake to better understand what routines are directly accessible and viable for consuming any type of fuzzer input.
Starting the Excavation
Our plugin will be developed for Binary Ninja, and it will rely on several metrics to generate a simple fuzzability score for each function in a given binary view. In the end, scores will be ranked highest-first, and the final results for all is then delivered tabulated back to the user for further analysis. Our fuzzability calculation is going to be very simple: if a metric is detected within the specific function, we’ll +1.
Let’s lay out the metrics that we care about as we statically analyze potential targets:
Metric #1: Function Identification
Our first metric is very simple: look at the function call itself and its parameters. A good target is often conveniently named to denote that it can take some type of direct raw input, with an argument or arguments that consume a raw buffer of bytes or a filename, and doing some type of processing on it that makes it suited for bughunting for crashes. For a function that does some type of parsing, this may involve incrementally scanning and error-checking a raw input, and then finalizing by generating some sort of structure with attributes to represent the parsed unit of code. For example:
xml_t* **parse**_xml_buffer(**char *buf**, size_t size)
So we’ll start by implementing our plugin callback run_fuzzable, which will iterate all over the available function symbols in the BinaryView of the binary, filter out those that are relevant, and then parse those out further with interesting patterns.
#!/usr/bin/env python
from binaryninja.enums import SymbolType

INTERESTING_PATTERNS = ["Parse", "Read", "Buf", "File", "Input", "String"]

def run_fuzzable(view):
    # parse out all functions
    funcs = view.functions

    # iterate over each function
    for func in funcs:

        # attributes we care about
        name = func.name
        symbol = func.symbol.type
        args = func.parameter_vars

        # we don't care about imports like glibc/Win32
        if (symbol is SymbolType.ImportedFunctionSymbol) or (
            symbol is SymbolType.LibraryFunctionSymbol
        ):
            continue

        # we also don't care about calls that start with `_`
        if name.startswith("_"):
            continue

        # check for interesting name and args if not stripped
        is_stripped = "sub_" in name
        interesting_name = False
        if not self.stripped:
            interesting_name = any(
                [
                    pattern in self.name or pattern.lower() in name
                    for pattern in INTERESTING_PATTERNS
                ]
            )

        # analyze function arguments for fuzzable patterns
        interesting_args = False
        for arg in args:
            if arg.type == "char*":
                interesting_args = True
                break

        # ...
Based on our initial implementation, when doing interesting function identification, here are all the criteria one should preferably meet to be a viable candidate for fuzzing:
- Should not be a imported function call referenced in the IAT or GOT that needs to be resolved dynamically.
- Should not start with
_, which is often used by dynamic instrumentation, profiling and unit-testing callbacks. - Preferably shouldn’t be stripped.
- If not stripped, should contain an interesting pattern within its symbol name that signal some type of raw input consumption behavior (ie.
Parse,Read,Buf). - Within the function, some type of
char*should be pushed onto the stack, either representing a pointer to an input buffer to read out of, or a filename to open and read out of.
Metric #2: Coverage Depth with Call Graphs
Our next metric concerns how something I like to call coverage depth, which we’ll measure by how many functions are called from a target. A key strategy a vulnerability researcher often keeps in their minds when doing any type of dynamic analysis is attempting to maximize the coverage their tooling reaches, as that would mean hitting as many control-flow edges as possible, since the probability of crashes to occur is linearly dependent on the implementation complexity. As a result, researchers will often try to find higher-level API routines to fuzz that invokes a lot of function callees and therefore has a higher coverage depth, rather than individually testing lower-level subroutines.
Our technique for measuring coverage depth is going to be simply generating a call graph with the target function as the root. This type of graphical representation is different from a control-flow graph, which represents a disassembly of a program with a basic-block granularity, whereas a call graph only does so at a function routines. As you may know, a control-flow graph comprised of basic-blocks is much more concise for visualizing control-flow edges, as branches occur at instructions that denote conditional jumps (ie jmp, jne, je). A high-level call graph is sufficient for our case, as we only care about how many levels of function calls and therefore instructions we’re going through for our coverage metric. Here’s a side by side visualization of a control-flow graph vs callgraph for two different routines within the YARA core library:
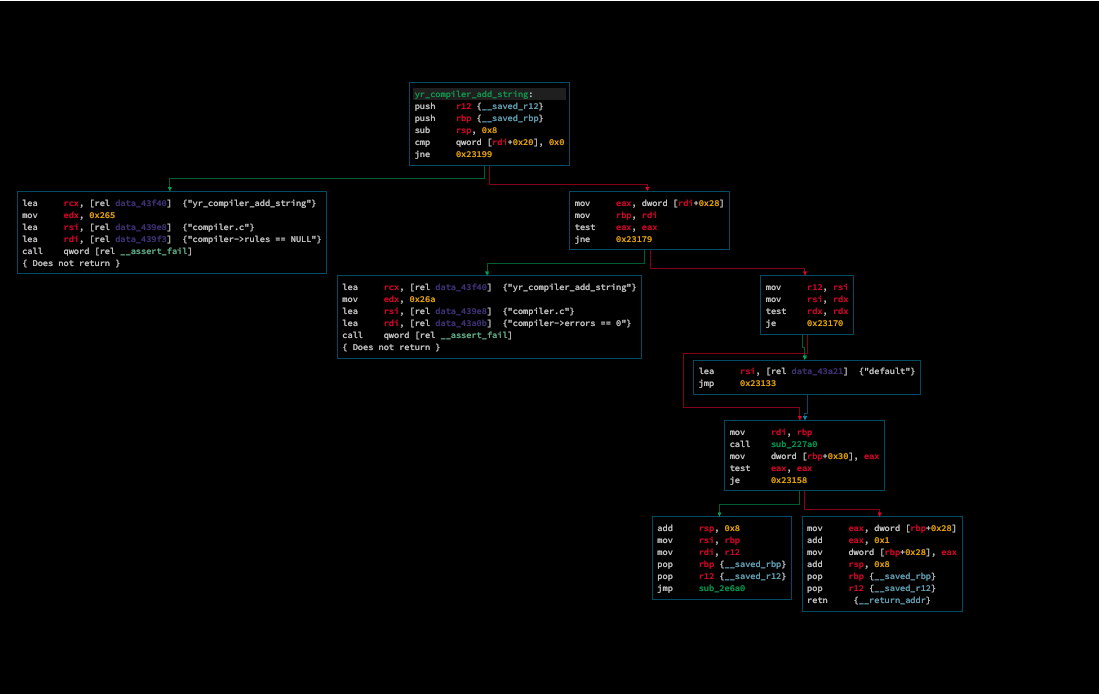
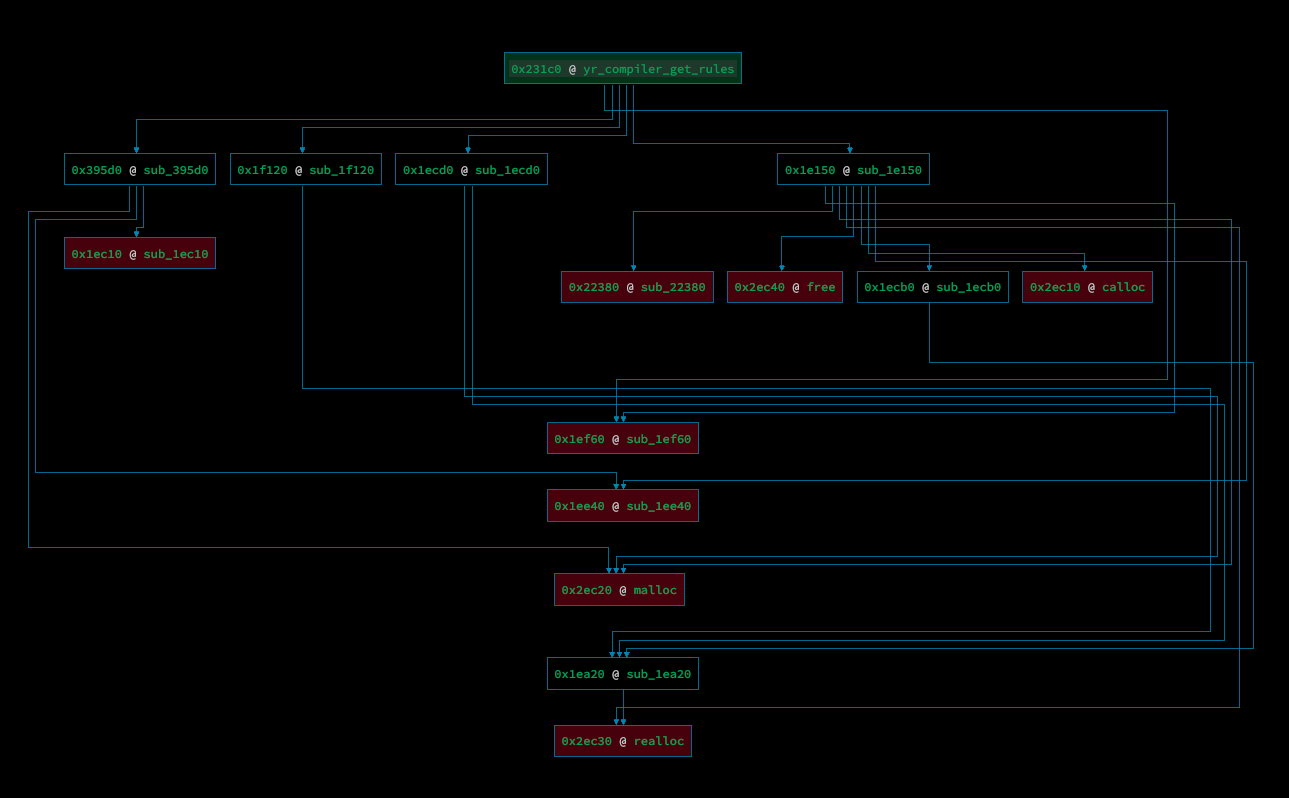
The plugin used in this example to generate our callgraph visualization is bncallgraph, written by @borzacchiello. Thanks!
Our strategy for this metric is doing a depth-first search through the whole graph, incrementing a depth counter until we reach the leaves, which are either calls with no more callees, or imported functions, such as from glibc. To do so, we’ll use a list to cache all the nodes we’ve already encountered, to ensure we’re not visiting the same over again if any back edges are present. Since this is depth-first search, a call stack is also used, which the current function callee is pushed and popped as we visit it. As a bonus, we also have the ability to determine whether or not the current target is recursive, if one of the callgraph nodes we reach has a back edge to the original root node.
@staticmethod
def get_callgraph_complexity(target) -> (int, bool, t.List[str]):
    """
    Calculates coverage depth by doing a depth first search on function call graph,
    return a final depth and flag denoting recursive implementation
    """

    depth = 0
    recursive = False

    # stores only the name of the symbol we've already visited
    visited = []

    # as we iterate over callees, add to a callstack and iterate over callees
    # for those as well, adding to the callgraph until we're done with all
    callstack = [target]
    while callstack:

        # increase depth as we finish iterating over callees for another func
        func = callstack.pop()
        depth += 1

        # add all childs to callgraph, and add those we haven't recursed into callstack
        for child in func.callees:
            if child.name not in visited:
                callstack += [child]

            # set flag if function makes call at some point back to current target,
            # increment cycle if recursive child is primary target itself,
            # meaning, there is recursion involved.
            elif child.name == target.name:
                recursive = True

        visited += [func.name]

    return (depth, recursive, visited)
Nice! We now have something that can give us some useful insight about how much coverage we would be able to reach for each specific routine in an executable. To determine whether or not our fuzzability score should be incremented, we’ll enforce a coverage depth threshold (I set a minimum of 100), where a depth higher will result in the score being incremented.
Metric #3: Natural Loops
Our final metric would concern the presence of loops within a specific routine. This might also be an important metric for a vulnerability researcher, as the use of loops can often correlate to behavior like input parsing, where raw bytes are iteratively scanned to be instantiated as a well-formed structure. These may be good places to look for conditions that can lead to infinite loops/memory exhaustion, off-by-one bugs, or out-of-bounds reads/writes.
We now need to approach each target function at a basic-block granularity, and will rely on the power of dominator trees in order to understand a general algorithm for detecting loops. Dominator trees are used in graph theory to visualize what basic block nodes must absolutely be visited in every path possible before settling on a specific target. I’ll take an example from the book where I’ve learned this from, Practical Binary Analysis (awesome read, buy it here):
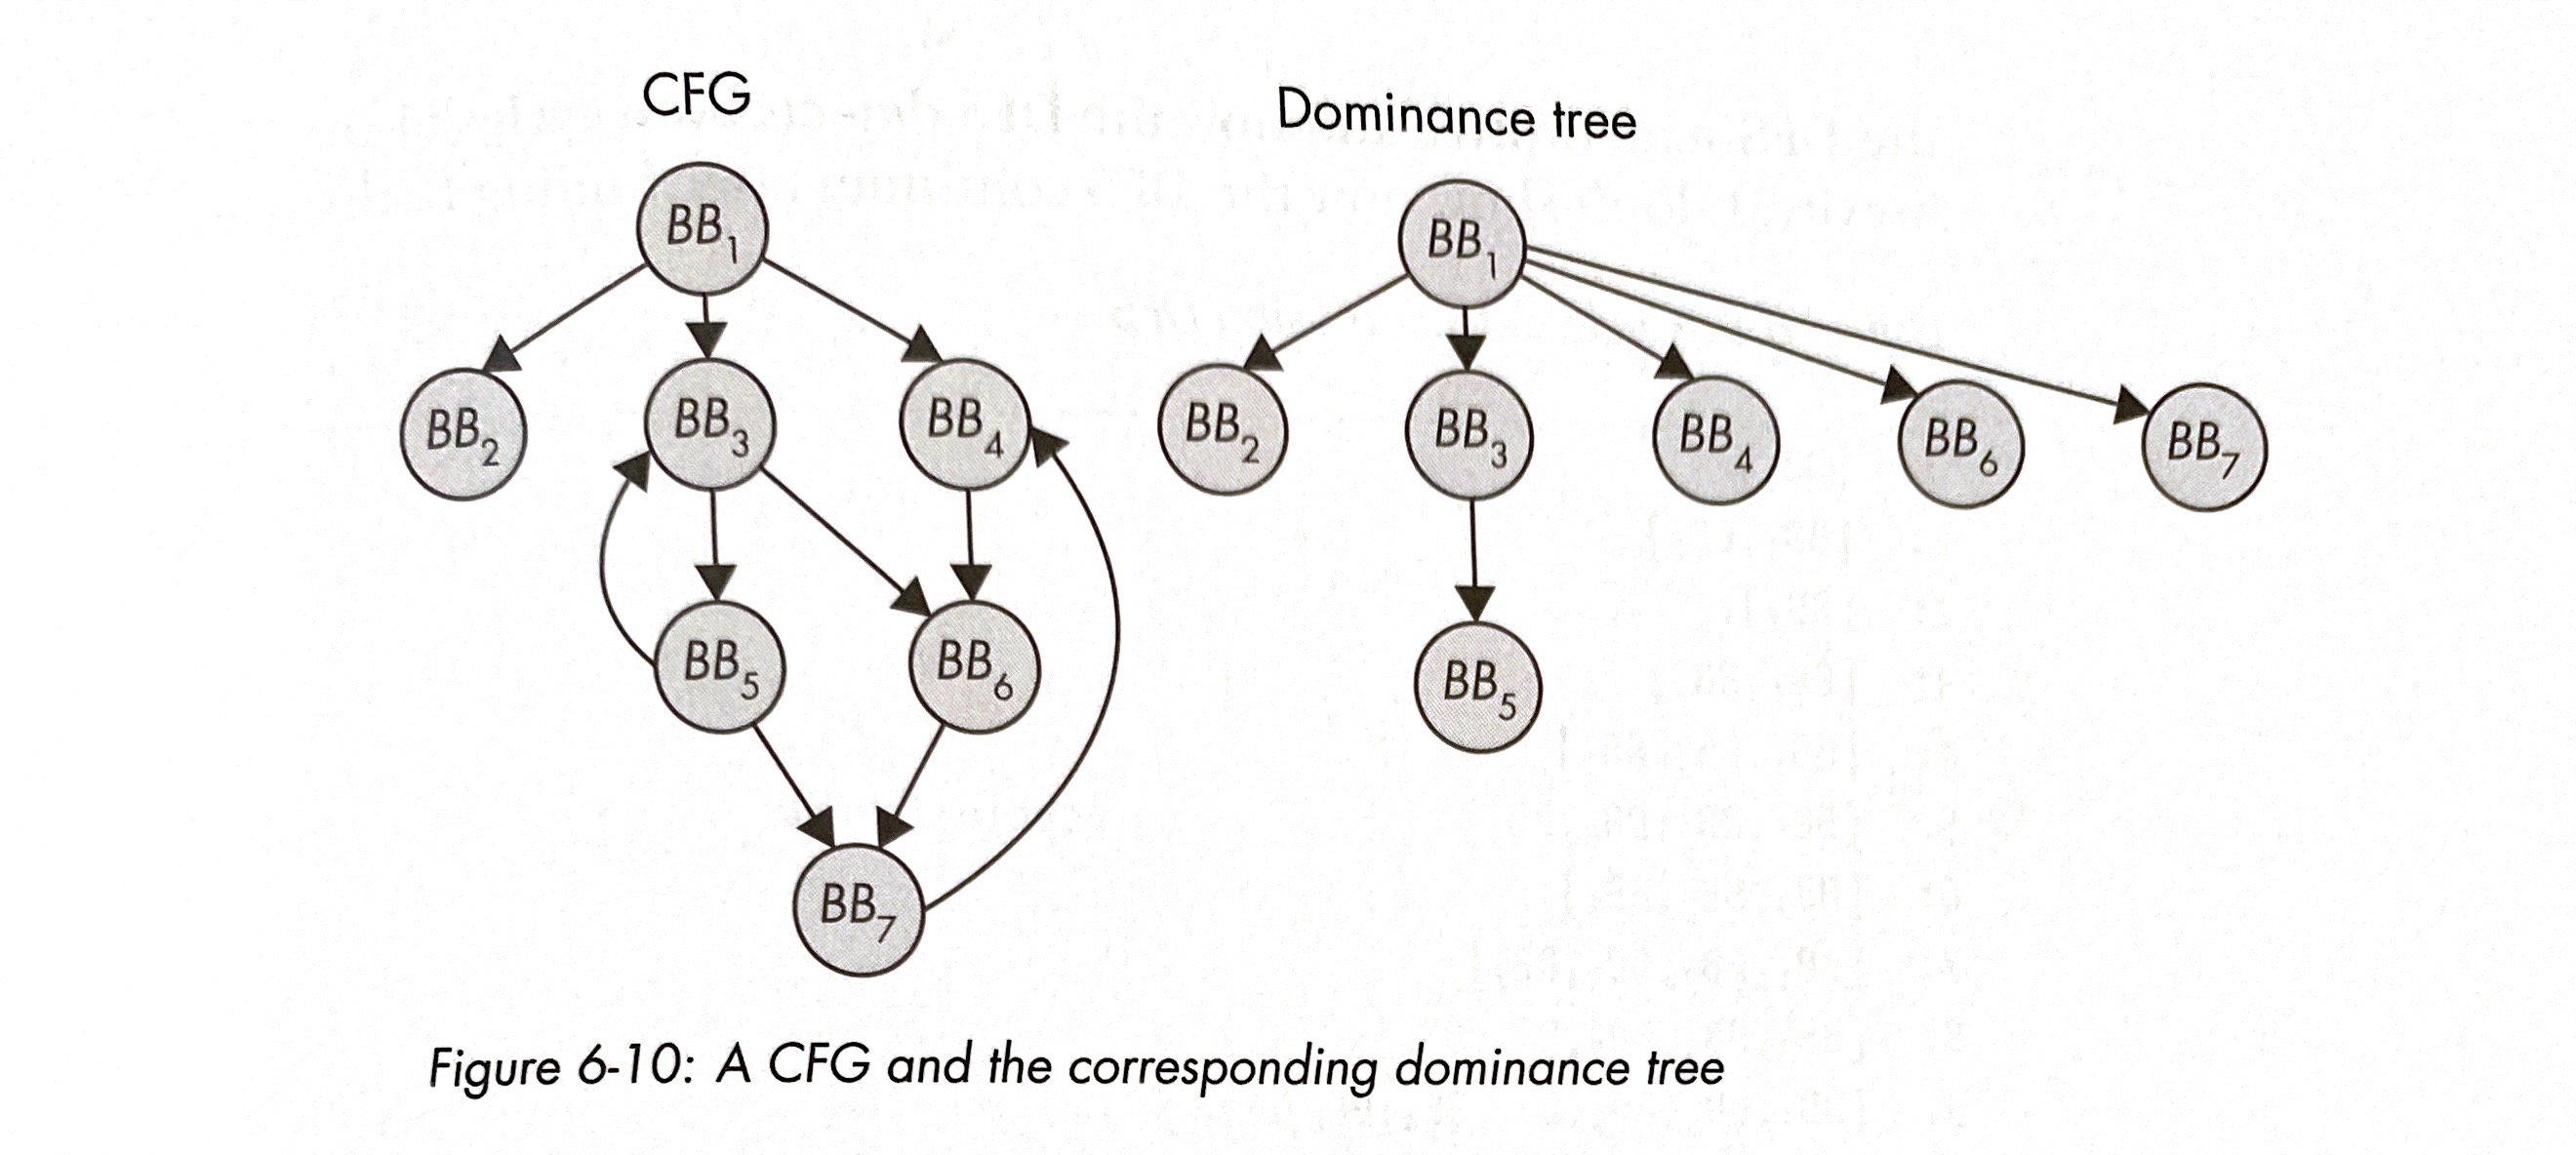
Node BB1 dominates all nodes because it will always be visited before settling on any of the other nodes. Similarly, BB3 also dominates BB5, since it will always be visited before reaching BB5. If we look at BB6 as a target, BB3 and BB4 are not its dominators because they represent splits in control flow: one or the other node can be visited before reaching BB6. BB6 is also not a dominator for BB7, since we don’t necessary need to visit BB6 before reaching BB7 (ie BB1 → BB3 → BB5 → BB7).
This is important because dominance trees are really useful for loop detection, and we can efficiently detect them using an attribute called the dominance frontier. A node Y is considered part of the dominance frontier set of a node X if X dominates the predecessor of Y, but does not strictly dominate Y. In this case, the word “strictly” is important: by definition, every node dominates itself, but when defining strict dominance, it excludes itself in that set. So looking back at our example from the book, the dominance frontier of BB3 is BB7, since BB3 dominates BB5, and BB7 is a successor of BB5 in the CFG. Furthermore, BB3 itself is also part of the dominance frontier set, since it does not strictly dominate itself.
As you can see from the example, loop detection occurs when a basic block is in its own dominance frontier, meaning that at some point in program execution, it must reach itself again, restarting the state again.
Luckily, Binary Ninja’s plugin API is super convenient, and exposes these attributes for each BasicBlock. So based on what we’ve discussed, we’ll simply iterate over each basic block in a target function, and check if the basic block itself is part of the dominance frontier set:
@staticmethod
def contains_loop(target) -> bool:
    """ Yes, it's that simple :) """
    for bb in target.basic_blocks:
        if bb in bb.dominance_frontier:
            return True
    return False
Since the given target may be a child as part of a larger callgraph, I also made sure that if the child has a natural loop, than the parent is set to have one as well.
We now have everything we need to calculate a fuzzability score!
from binaryninja.settings import Settings

@property
def fuzzability(self) -> float:
    """
    Calculate a final fuzzability score once analysis is completed.
    """

    score = 0.0

    # function is publicly exposed
    if not self.stripped:
        score += 1

        # name contains interesting patterns often useful for fuzz harnesses
        if self.interesting_name:
            score += 1

    # function signature can directly consume fuzzer input
    if self.interesting_args:
        score += 1

    # function achieved an optimal threshold of coverage to be fuzzed
    depth_threshold = int(Settings().get_string("fuzzable.depth_threshold"))
    if self.depth >= depth_threshold:
        score += 1

    # natural loop is present. Keep in mind this will also increase
    # the score of any parent calls this target is a part of.
    if self.has_loop:
        score += 1

    return score
Target Practice
I added some more components to the plugin that helped rendered out results as a seperate Markdown table, and also sorted our results parsed for each function by fuzzability to finalize how we deliver results efficiently back to the user.
Make sure that the root of the project is in the Binary Ninja plugin directory for your respective operating system (you can use a symlink if developing on the plugin somewhere else further). Once a binary view is opened, click on Tools > Plugins > Fuzzable > Analyze Fuzzable Targets to run the static analysis. A seperate tab will pop with your results!
Let’s throw some executables and libraries against the plugin and see how well it works! The first target I looked at is MJS, which is a JS interpreter that I found an off-by-one heap overflow (CVE-2021-31875) in:
Looks good! If I was doing vulnerability assessment on a black-box version of the executable, mjs_exec_file would absolutely by the optimal routine to pick out to generate a harness for.
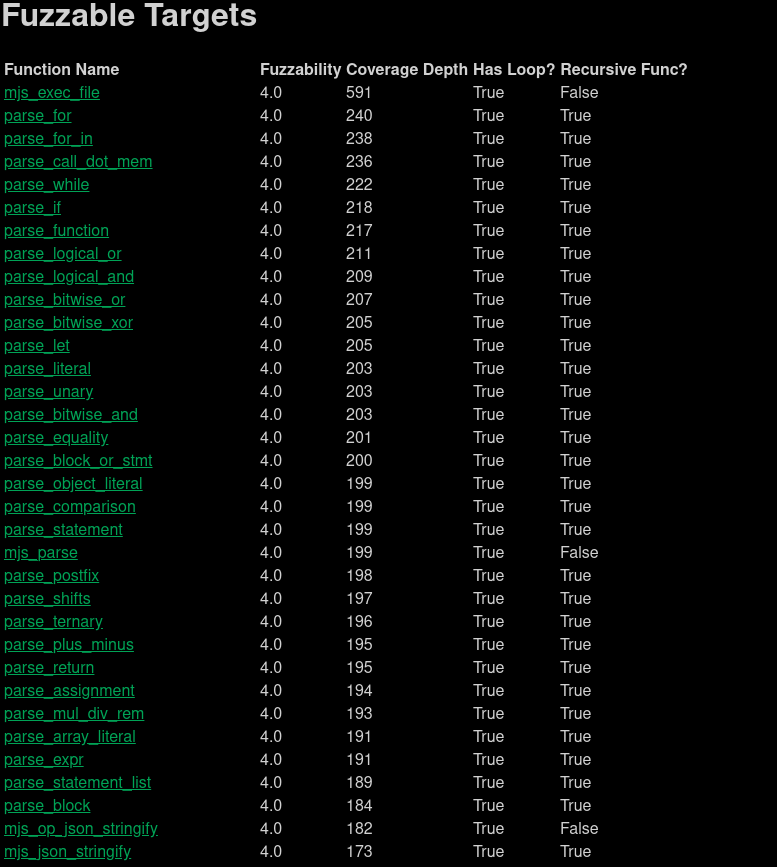
Let’s also throw YARA’s shared object library, libyara.so, against the plugin:
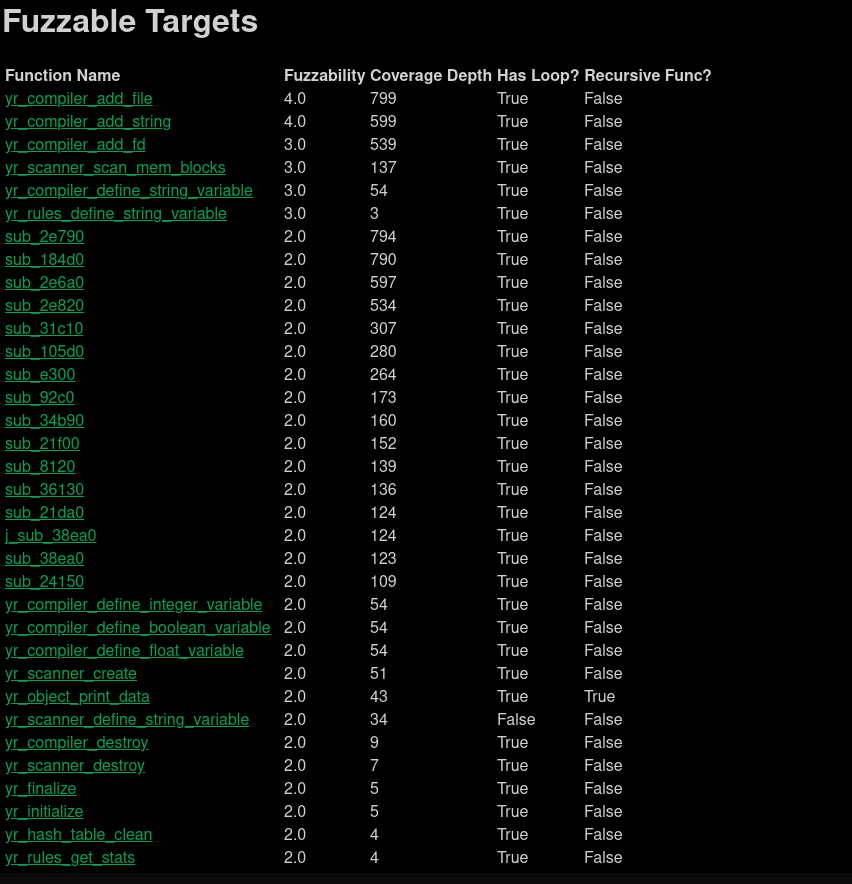
Neat! We get some good potential targets we can select as well.
Bonus: Automated Harness Generation
I wanted to also touch base on how fuzzable can be powered even further to not just find optimal targets to fuzz, but also automatically generate the harnesses for us themselves.
The fuzzable plugin has an experimental feature called Generate Fuzzing Harness, which will extrapolate the features from a given function, and create a simple libFuzzer/AFL harness from a template. I’m going to add support for Window harnesses as I dive more into Windows exploitation.
Note that this is still an academic research endeavor, as it sits well within the realm of program synthesis. For fun research pieces, check out the work done by Georgia Tech’s SSLab with Winnie, and Google/EPFL’s work with FuzzGen.
Future Endeavors
This seems like a really good first step, but I haven’t had the opportunity to throw our plugin against a large dataset of diverse targets to really stress test how it’s able to accurately identify good fuzzing targets. Therefore, this plugin certaintly won’t be perfect in-the-wild, due to the wild diversity of how software is implemented.
One feature that I hope to incorporate in the future (maybe with your help!) is machine-learned ranking (aka Learning to Rank), where we construct ML-based learning models to help us accurately rank such targets given features (hence why fuzzable has a CSV export feature 🙂). This is something that’s had commercial success in security detection, specifically with FireEye’s stringsifter, which implements this to help malware reverse engineers rank and identify interesting strings from a sample quicker, such as URL endpoints, BTC addresses, etc.
I’m interested to see more work similar to this in the future, as it seems surprisingly underdeveloped, and can be extremely useful in the vulnerability discovery process. Feel free to check out the repository for fuzzable here, suggest features you want to see, or improve upon it!